


Regression is a method that is used to analyze and understand the relationship between two or more variables of interest. It helps to analyse how one variable is influencing the output.
You have got two types of variables that are been used in Machine Learning models.
Dependent variable: The variable whose value is determined by another variable is known as a dependent variable.
Independent variable: The variable whose value is determined by another variable is known as an independent variable.
Types of Regression Techniques:
Simple Linear Regression
Multiple Linear Regression
Polynomial Regression
Support Vector Regression
Decision Tree Regression
Random Forest Regression
Each technique has its own merits and demerits. A regression model is applied to your dataset if the output should be in continuous order. A regression model is applied to your dataset if the output is dependent on the input variables.
Steps to build the models.
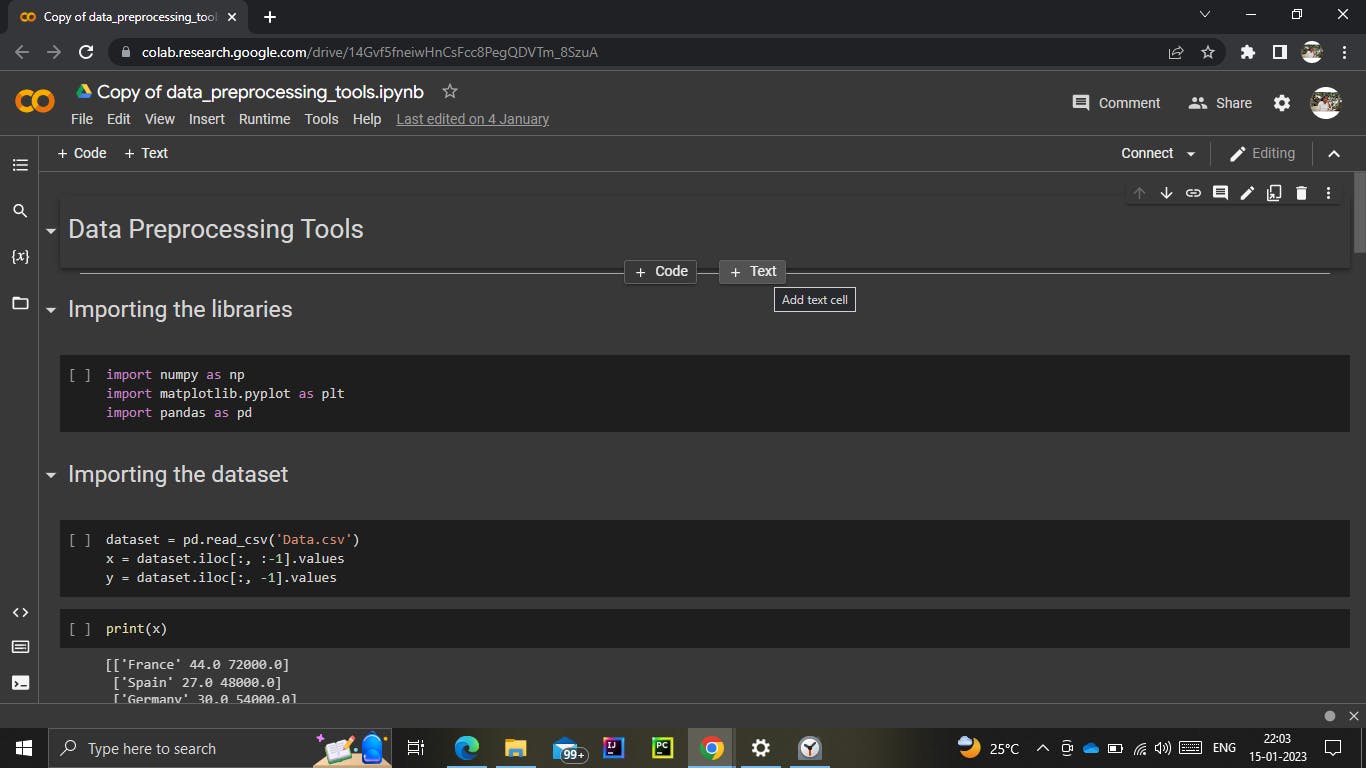
Step 1: Import Libraries and Datasets.
Libraries are the best friends of all programmers. Libraries allow programmers to write code much more efficiently and write code faster.
The common libraries used in a machine-learning model are pandas, numpy and matplotlib.
The datas from a csv file can be imported using read_csv() from the pandas library.
Steps 2: Data Preprocessing.
Data preprocessing is removing unwanted and unnecessary data from the dataset. It is a method that is performed as the first step before building the model.
1. Handling datas.
Let's take an example of it. A company is collecting customers' details using a form. But some of the customers fail to enter details such as phone number, address or age. Such datas can affect the whole prediction completely and lead to false prediction.
The handling of datas can be done using many ways. But the method I would recommend is replacing the missing value with the mean of the column.
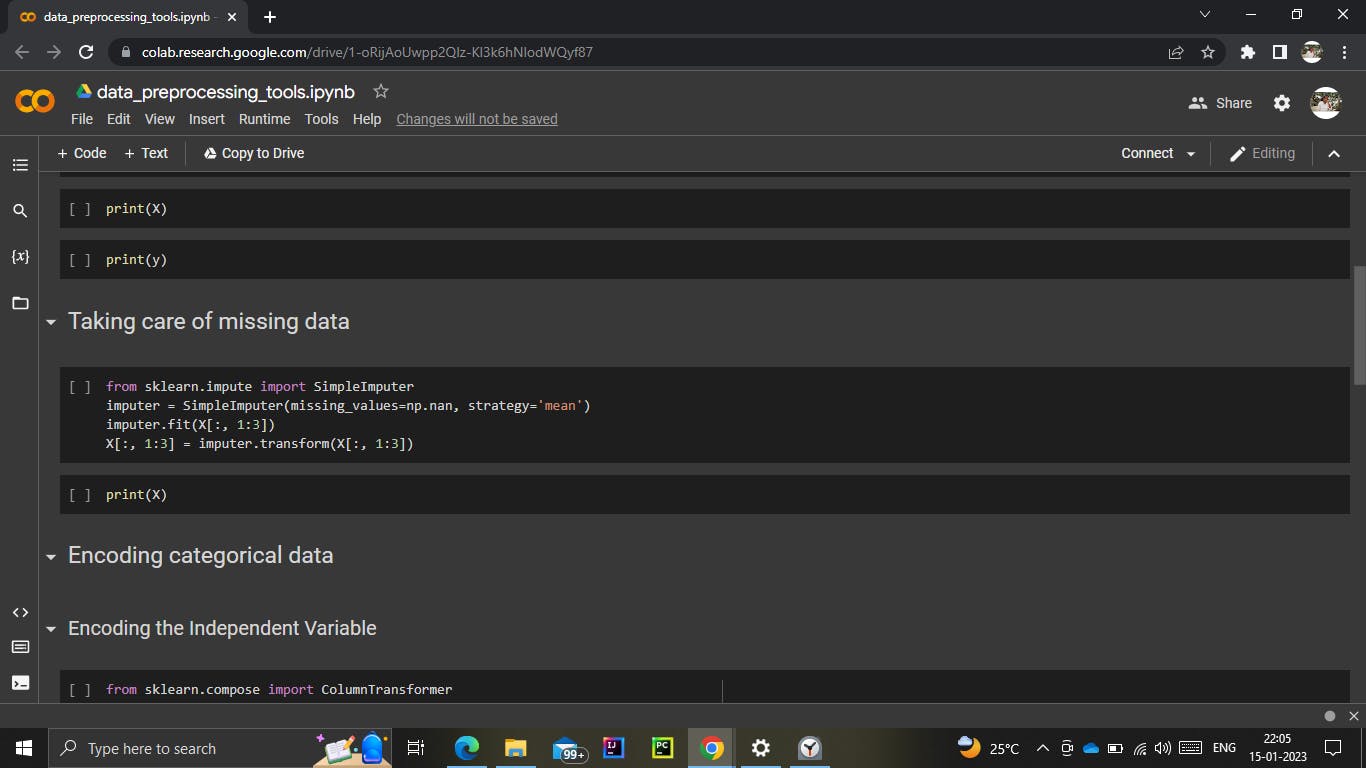
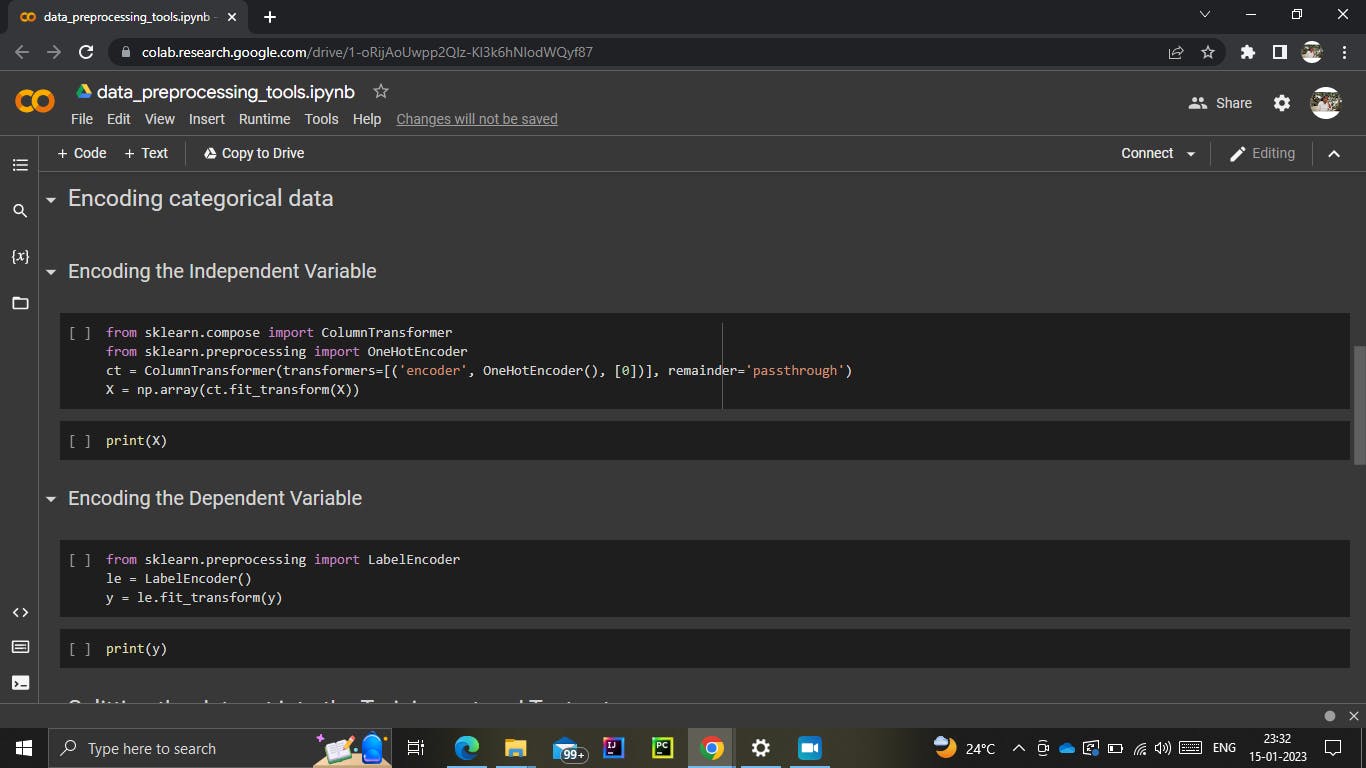
2. Encoding the categorical data.
The data can be either in terms of numbers or in form of letters. When the data is in the form of letters, then the data cannot be intercepted as most of the data can be evaluated using numbers only.
A powerful class used to encode the categorical data is OneHotEncoder.
3. Splitting the data into training and testing sets
Ideally, we have to train our model using a portion of the whole data set and another portion can be used to see how well another model can predict the values.
This is the reason why we have to split our dataset into training and testing sets. The ideal ratio for the training and testing set is 80% of the training set and 20% of the testing set.
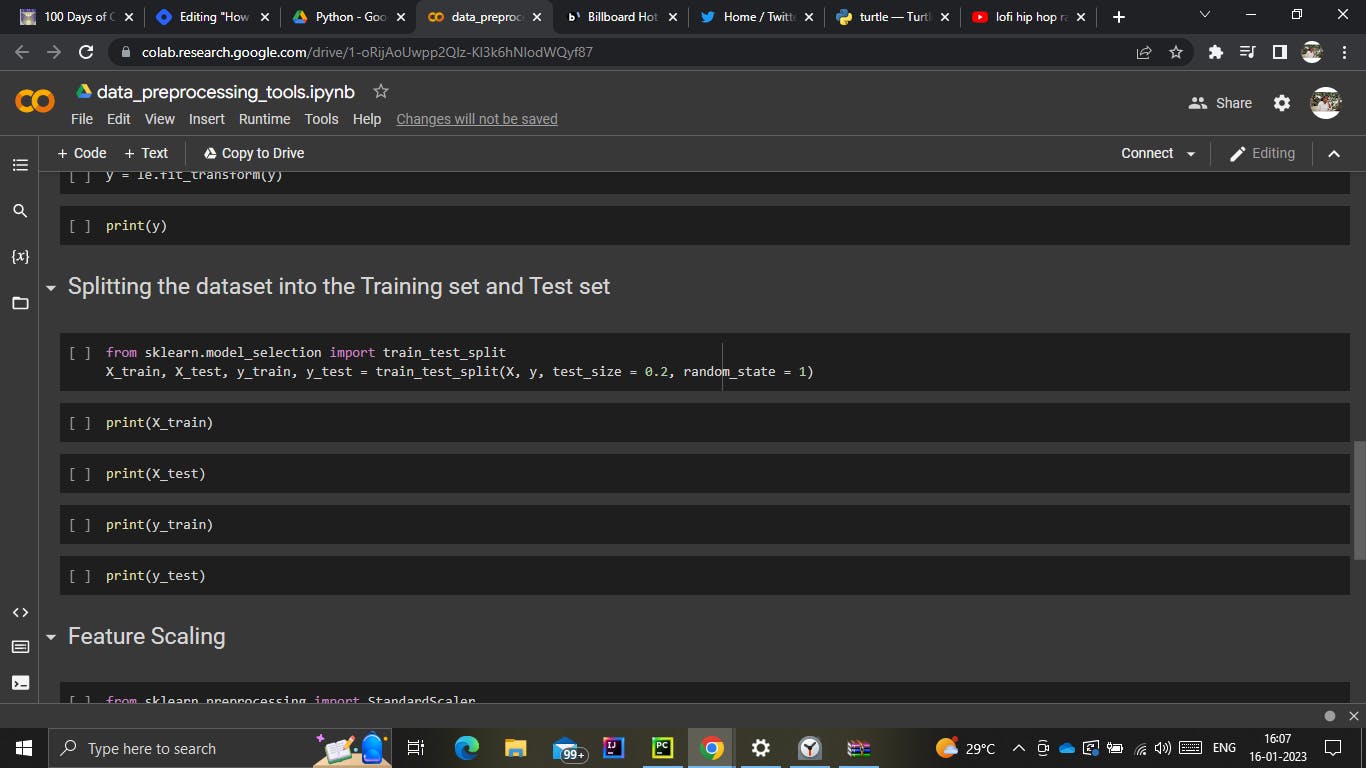
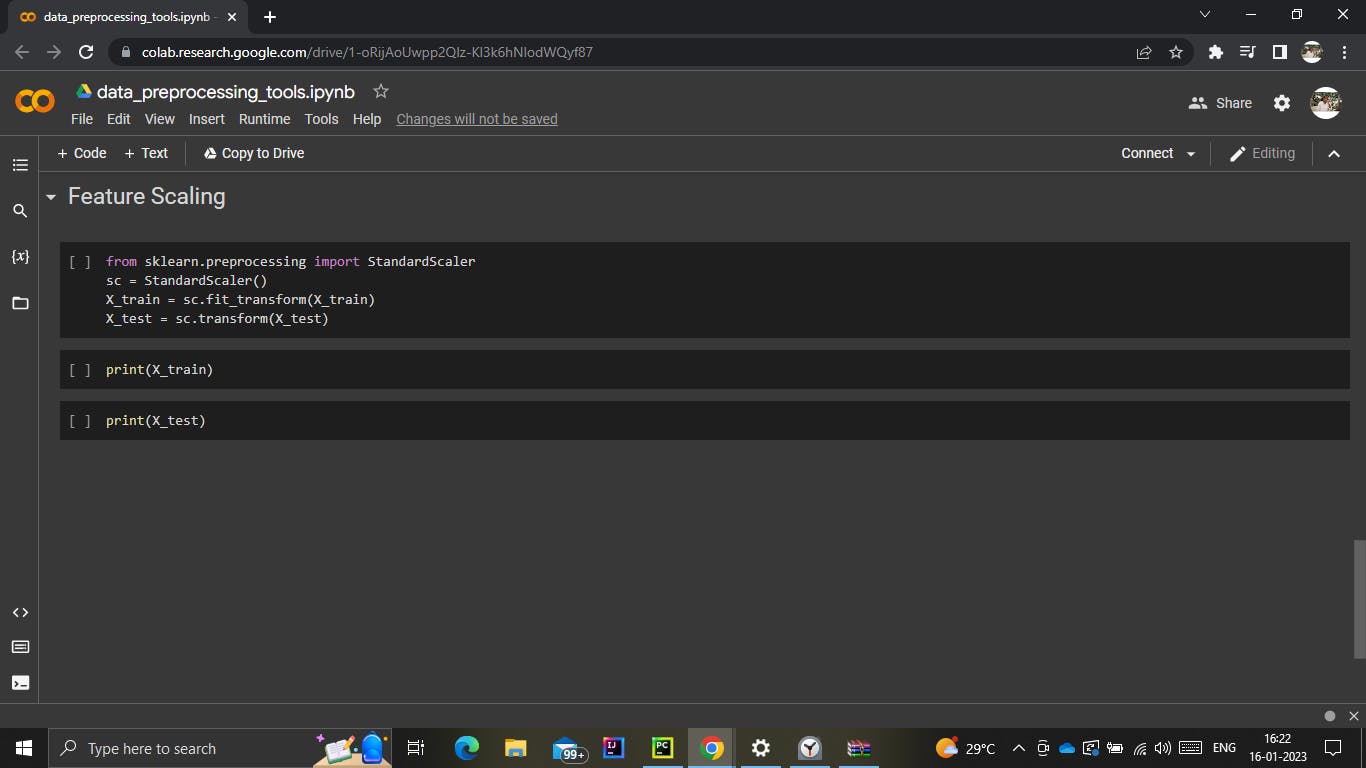
4. Feature Scaling
When it comes to numerical data, it is very hard to predict various features with just the numerical value alone. Let me explain to you with an example.
| Veg | PRICE | WEIGHT |
| 1 | 100 | 3 |
| 2 | 200 | 5 |
If I ask you the question, "Which vegetable is priced less?" and if your answer to the question is Rs. 100, then your answer is definitely wrong. It is very hard to come to a such conclusion when the features are in different ranges.
From the above example, you can see that both price and weight aren't in the same range and this will be the reason for predicting the wrong results.
The feature scaling comes to the rescue in terms of such misleading predictions. Feature scaling performed some calculations and the results will be in the same range.
STEP 3: Train the model.
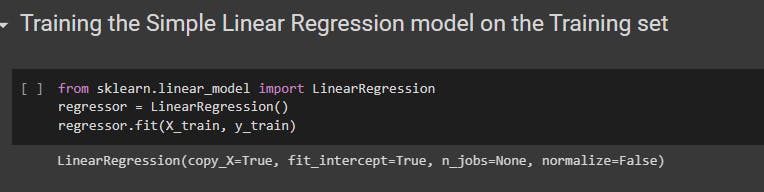
1. Simple Linear Regression.
The class used in simple linear regression is LinearRegression from the sklearn.linear_model library.
Create an object from the class LinearRegression.
Using the object that has been created, call the fit() with parameters as training sets to train your model.
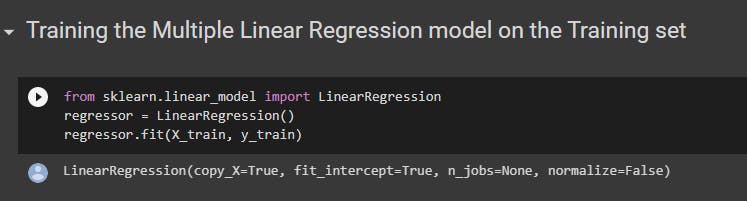
2. Multiple Linear Regression
The class used in multiple linear regression is LinearRegression from the sklearn.linear_model library.
Create an object from the class LinearRegression.
Using the object that has been created, call the fit() with parameters as training sets to train your model.
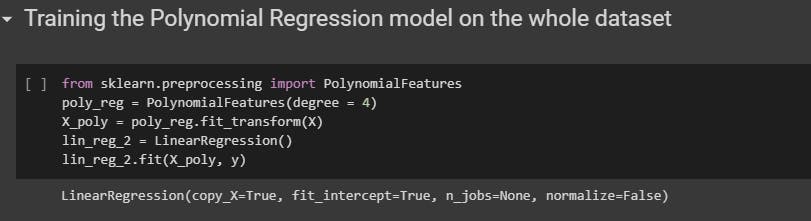
3. Polynomial Regression
The class used in polynomial regression is PolynomialFeatures from the sklearn.preprocessing library.
Create an object from the class PolynomialFeatures and specify the degree you want to work with.
Create a new variable that stores the features with higher powers.
Using the object that has been created, call the fit() with parameters as training sets to train your model.
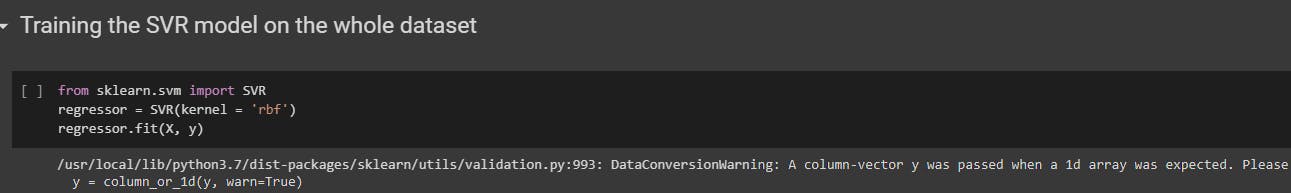
4. Support Vector Regression
The class used in support vector regression is SVR from the sklearn.svm library.
Create an object from the class SVR with kernel as rbf**.**
Using the object that has been created, call the fit() with parameters as training sets to train your model.
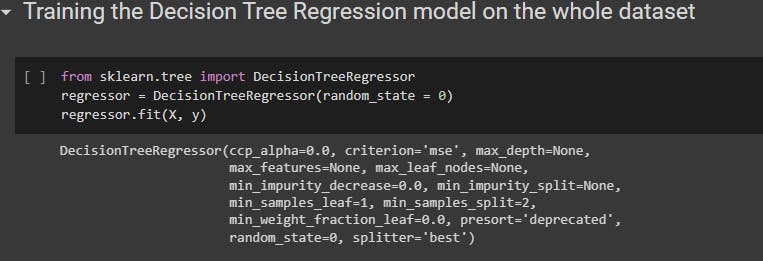
5. Decision Tree Regression
The class used in decision tree regression is DecisionTreeRegressor from the sklearn.tree library.
Create an object from the class DecisionTreeRegressor with the parameter random_state as 0**.**
Using the object that has been created, call the fit() with parameters as training sets to train your model.
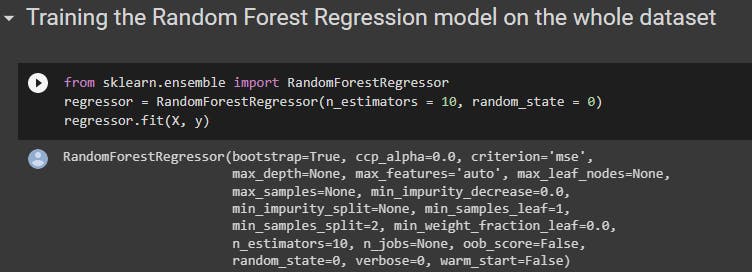
6. Random Forest Regression
The class used in random forest regression is RandomForestRegressor from the sklearn.ensemble library.
Create an object from the class RandomForestRegressor.
Using the object that has been created, call the fit() with parameters as training sets to train your model.
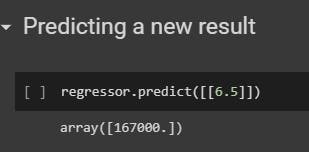
STEP 4: Predict.
This is probably the easiest step. It requires only one method. The predict() method is used to predict any value. It returns the predicted outcome.
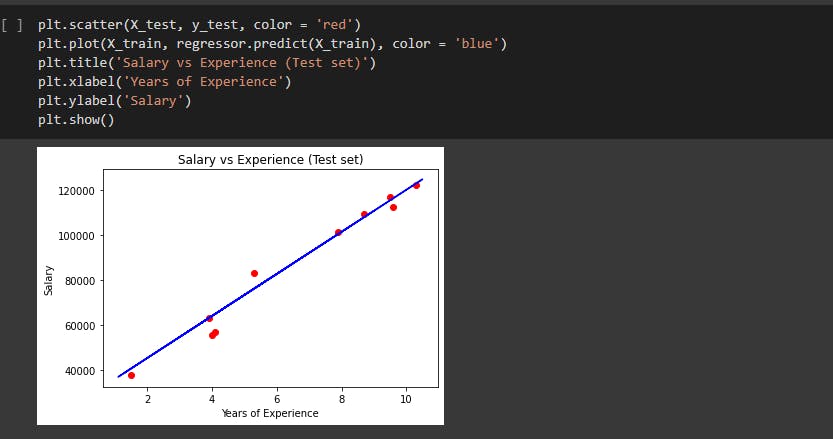
STEP 5: Visualize.
Humans tend to analyse and understand the data much more efficiently when it is visualized. This makes the visualization part much more important than any other step.
The matplotlib.pyplot is used in such visualization.
scatter() is used to plot the data points on the graph.
plot() allows you to draw the regression line which is the predicted value.
title() is used to provide the title of the graph.
xlabel() and ylabel() are used to label the x and y axis respectively.
Finally the show() is used to display the graph.
Conclusion
Every model has its pros and cons. Use the model according to the data set and the output you are expecting.
Exploration and experimentation is the best way to know the advantage of using a model.